Introduction
Cardiovascular diseases (CVDs) are the number 1 cause of death globally, taking an estimated 17.9 million lives each year, which accounts for 31% of all deaths worldwide. Four out of 5CVD deaths are due to heart attacks and strokes, and one-third of these deaths occur prematurely in people under 70 years of age. Heart failure is a common event caused by CVDs and this dataset contains 11 features that can be used to predict a possible heart disease.
People with cardiovascular disease or who are at high cardiovascular risk (due to the presence of one or more risk factors such as hypertension, diabetes, hyperlipidaemia or already established disease) need early detection and management wherein a machine learning model can be of great help.
Objectives
The main objective of this work is to predict if a patient is at risk of having heart disease or not, based on the common features of patients with heart disease. To that end, four different methods, including random forest, naïve bayes, kernel SVM, and XGBoost are exploited and their performance is compared to find the best model for the prediction of heart disease.
Finally, the obtained results are interpreted with SHAP values to see the effect of each feature on the prediction. It can help clinicians to better understand the reasons behind the prediction.
Description of the dataset
This dataset was created by combining different datasets already available independently but not combined before. In this dataset, 5 heart datasets with a total of 918 observations are combined over 11 common features which makes it the largest heart disease dataset available so far for research purposes. The features are as the following:
- Age: age of the patient [years]
- Sex: sex of the patient [M: Male, F: Female]
- ChestPainType: chest pain type [TA: Typical Angina, ATA: Atypical Angina, NAP: Non-Anginal Pain, ASY: Asymptomatic]
- RestingBP: resting blood pressure [mm Hg]
- Cholesterol: serum cholesterol [mm/dl]
- FastingBS: fasting blood sugar [1: if FastingBS > 120 mg/dl, 0: otherwise]
- RestingECG: resting electrocardiogram results [Normal: Normal, ST: having ST-T wave abnormality (T wave inversions and/or ST elevation or depression of > 0.05 mV), LVH: showing probable or definite left ventricular hypertrophy by Estes’ criteria]
- MaxHR: maximum heart rate achieved [Numeric value between 60 and 202]
- ExerciseAngina: exercise-induced angina [Y: Yes, N: No]
- Oldpeak: oldpeak = ST [Numeric value measured in depression]
- ST_Slope: the slope of the peak exercise ST segment [Up: upsloping, Flat: flat, Down: downsloping]
- HeartDisease: output class [1: heart disease, 0: Normal]
Findings
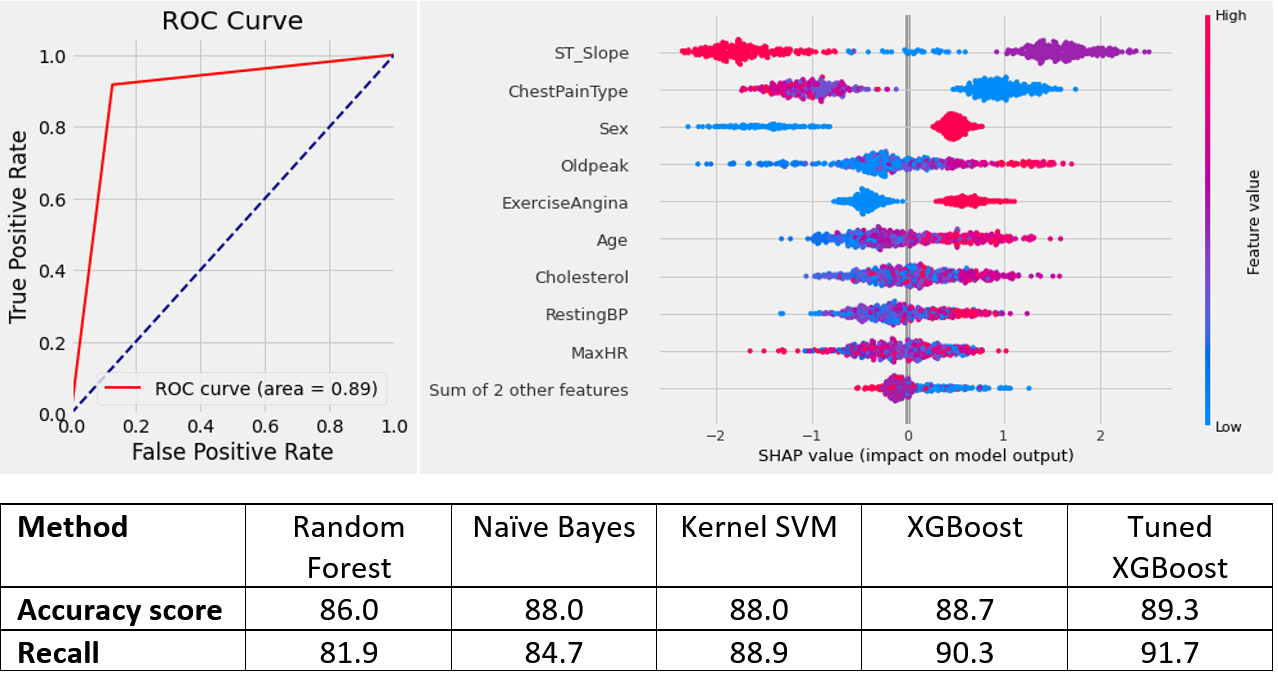
Comparing the performance of the four different techniques, XGBoost outperformed the others by the accuracy and recall scores of 88.7 and 90.3, respectively. Tuning the hyperparameters of XGBoost could increase the accuracy and recall scores of prediction to 89.3 and 91.7, respectively.
The SHAP values were calculated globally and locally to explain the impact of each feature on the model, as well as the symptoms of each patient that led to their associated diagnosis. From the SHAP value plots, we can conclude that:
- ST_Slope has the highest contribution to the prediction.
- High ST_Slope values (upsloping) pushes the prediction to class 0 (Normal), while the flat slope of the peak exercise ST segment pushes the model output to heart disease.
- Patients with ASYM ChestPainType, which is encoded to 0 (blue colour in the graph) are more likely to have heart disease.
- Males (encoded to 1) are more likely to have heart disease than females.*
- People who have high oldpeak, are more prone to heart disease.
- Higher the exercise angina, the higher the chance of having heart disease
- Older patients are more at risk of having heart disease
Source of data:
https://archive.ics.uci.edu/ml/machine-learning-databases/heart-disease/
https://www.kaggle.com/fedesoriano/heart-failure-prediction/
Link to the code